Curve fitting with Python
First we need a NumPy and MatPlotLib modules.
Look at curve fitting explanation from wiki.
Second degree polynomial equation would help us: y=ax^2 + bx + c
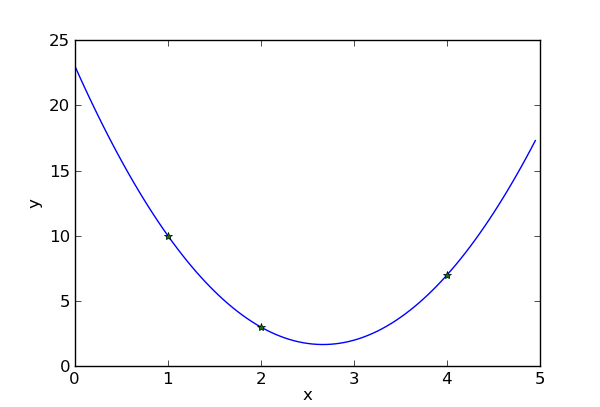
This will exactly fit a simple curve to three points.
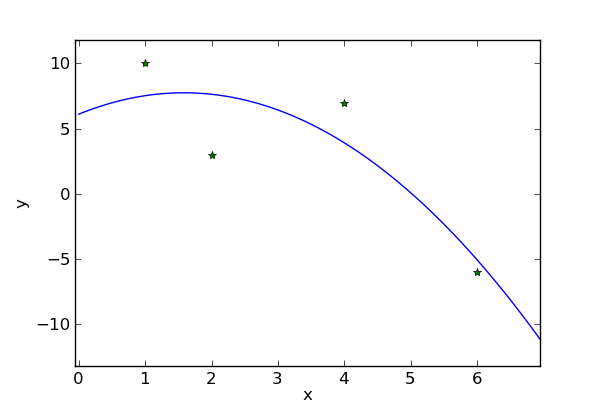
Using more points we get a nearest possible curve.
# Import modules
from numpy import *
from matplotlib.pyplot import *

# Input data (change it)
# X and Y points must have same length
x = [1,  2,  4,   6]
y = [10, 3,  7,  -6]

# (a, b, c) coefficients computation
coefficients = polyfit(x, y, 2)

# With coefficients we make a polynomial object
poly = poly1d(coefficients)

# Create point series
xs = arange(min(x)-1, max(x)+1, 0.05)

# Calculate resultant series
ys = poly(xs)

# Finally draw everything
plot(xs, ys)
plot(x, y, 'o')

# X and Y axis label
ylabel('y')
xlabel('x')

# And show
show()

